 Linkedlytics
LinkedIn analytics
Understand what your LinkedIn content is achieving.
Bring post performance, audience quality, and client reporting into one workflow. Linkedlytics helps you see what reached people, who engaged, and what deserves another experiment.
01
Look at the posts
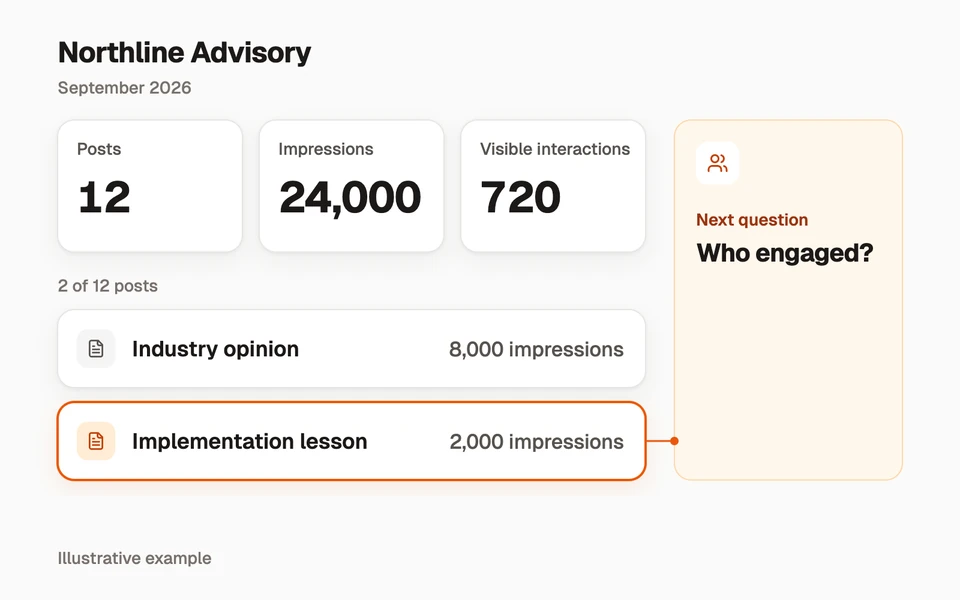
A monthly total tells you that something changed. The individual posts help explain why. Explore impressions, reactions, comments, and reposts, then compare the topics and formats behind your results.
Use the same profile selection and date range when comparing periods. Missing metrics and incomplete collection should remain visible in your interpretation.
- Rank posts by supported metrics or a custom score.
- Filter content and reuse saved views.
- Compare periods before deciding what to repeat.
Illustrative analysis · synthetic data
September content review
- Posts published
- 12
- Impressions
- 24,000
- Visible interactions
- 720
- Interaction rate by impressions
- 3.00%
02
See who engaged
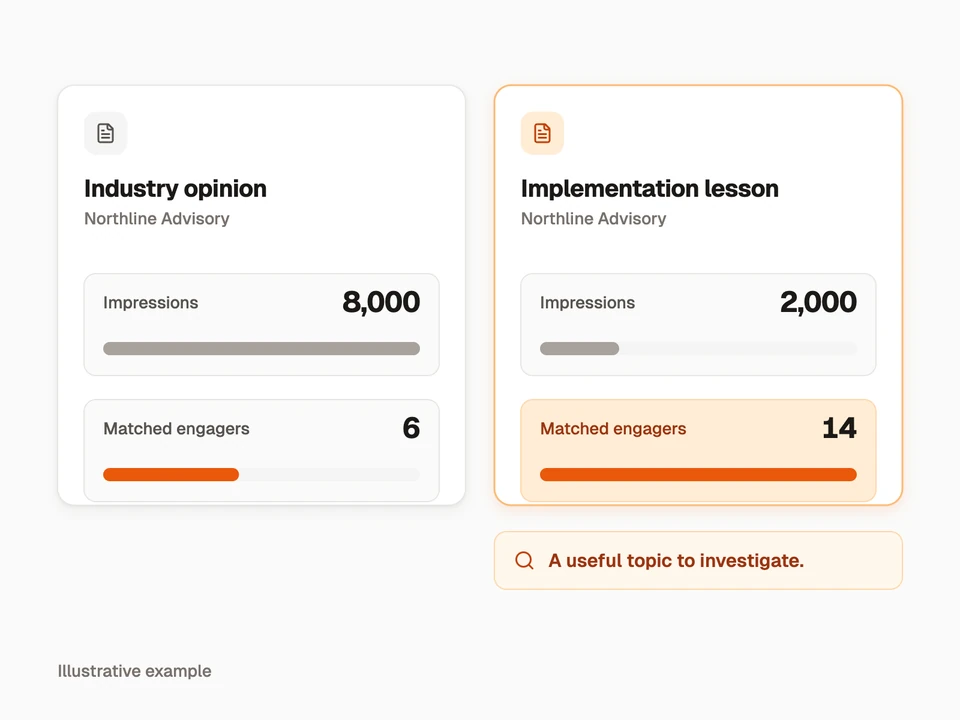
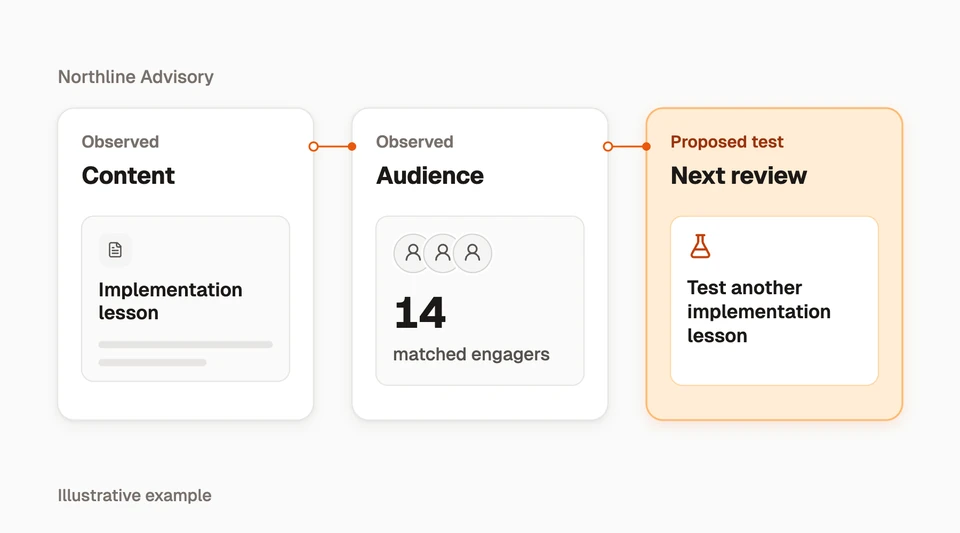
A high-reach post and a useful business conversation are different outcomes. Inspect the available engager information and compare it with your ideal customer profile (ICP).
Use audience fit to sharpen your next content decision. An ICP match is an assessment against your criteria, not proof of buying intent or revenue.
03
Choose your workflow
Native LinkedIn analytics are a useful starting point for reviewing your own activity. Linkedlytics adds a workflow for organising connected profiles, examining available audience information, sharing reports, and asking supported AI clients to work with your data.
Start with native analytics if a periodic individual review is enough. Evaluate Linkedlytics when a repeatable reporting process or multiple client profiles make the work more involved.
| Job | Native review workflow | Linkedlytics workflow |
|---|---|---|
| Review a post | Inspect its available analytics in LinkedIn. | Find and compare collected posts in a content view. |
| Prepare a client review | Collect the figures and assemble your own report. | Configure and share a saved report. |
| Understand audience fit | Review relevant people and context yourself. | Use available engager information and your ICP criteria. |
| Work with an AI assistant | Provide the data you choose to share. | Grant a supported MCP client access to selected workspaces. |
04
Check data coverage
These workflows focus on organic LinkedIn content and the profiles available in your workspace. Connected personal profiles, tracked profiles, and company profiles may have different metrics and permissions.
Linkedlytics does not promise a complete historical backfill or identical coverage for every account. Check available dates and the latest successful collection before presenting results. This page does not describe LinkedIn Ads or multi-network reporting.
Questions, answered
Can I use Linkedlytics without an AI app?
Yes. Content views, audience insights, and reports are available in Linkedlytics. MCP is an optional way to work with the data through a compatible AI client.
Does engagement rate show content ROI?
No. Engagement rate measures a defined set of interactions relative to a denominator. Connecting content to pipeline or revenue requires additional attribution evidence.
Explore your LinkedIn results
Start your free trial to connect your profile and explore your available content and audience data.
Start a trial to explore your LinkedIn analytics7-day free trial